Golub et al. (1999) Leukemia data set | [X] |
Short description: Analysis of patients with acute lymphoblastic leukemia (ALL, 1) or acute myeloid leukemia (AML, 0). Sample types: ALL, AML No. of genes: 7129 No. of samples: 72 (class 0: 25, class 1: 47) Normalization: VSN (Huber et al., 2002) References: - Golub et al., Molecular Classification of Cancer: Class Discovery and Class Prediction by Gene Expression Monitoring, Science (1999), 531-537 - Huber et al., Variance stabilization applied to microarray data calibration and to the quantification of differential expression, Bioinformatics (2002) 18 Suppl.1 96-104 |
Yeoh et al. (2002) Leukemia multi-class data set | [X] | ||
Short description: A multi-class data set for the prediction of the disease subtype in pediatric acute lymphoblastic leukemia (ALL).
No. of samples: 327 Normalization: VSN (Huber et al., 2002) References: - Yeoh et al. Classification, subtype discovery, and prediction of outcome in pediatric acute lymphoblastic leukemia by gene expression profiling. Cancer Cell. March 2002. 1: 133-143 - Huber et al., Variance stabilization applied to microarray data calibration and to the quantification of differential expression, Bioinformatics (2002) 18 Suppl.1 96-104 |
Hall's CFS - Combinatorial Feature Selection | [X] |
Short description: Hall's CFS is a combinatorial correlation-based feature selection algorithm. A greedy-best first search strategy is used to identify features with high correlation to the response variable but low correlation amongst each other based on the following scoring function: where S is the selected subset with k features and is the average feature-class correlation and the average feature-feature correlation. References: - Hall, M.A., Correlation-based feature selection for discrete and numeric class machine learning, Proceedings of the Seventeenth International Conference on Machine Learning (2000), p. 359-366 |
PLS-CV - Partial Least Squares Cross-Validation | [X] |
Short description: The importance of features is estimated based on the magnitudes of the coefficients obtained from training a Partial Least Squares classifier. The number of PLS-components n is selected based on the cross-validation accuracies for 20 random 2/3-partitions of the data for all possible values of n. We use the PLS-implementation in R by Boulesteix et al. References: - Hall, M.A., Correlation-based feature selection for discrete and numeric class machine learning, Proceedings of the Seventeenth International Conference on Machine Learning (2000), p. 359-366 |
Significance analysis of microarrays (SAM) | [X] |
Short description: SAM (Tusher et al., 2001) is a method to detect differentially expressed genes that uses permutations of the measurements to assign significance values to selected genes. Based on the expression level change in relation to the standard deviation across the measurements a score is calculated for each gene and the genes are filtered according to a user-adjustable threshold (delta). The False Discovery Rate (FDR), i.e. the percentage of genes selected by chance, is then estimated from multiple permutations of the measurements. We use the standard SAM-implementation from the samr-package (v1.25). References: - Tusher, V., Tibshirani, R. and Chu, G.: Significance analysis of microarrays applied to the ionizing radiation response", PNAS 2001 (98), p. 5116-5121 |
Empirical Bayes moderated t-test (eBayes) | [X] |
Short description: The empirical Bayes moderated t-statistic (eBayes, Loennstedt et al., 2002) ranks genes by testing whether all pairwise contrasts between different outcome-classes are zero. An empirical Bayes method is used to shrink the probe-wise sample-variances towards a common value and to augment the degrees of freedom for the individual variances (Smyth, 2004). For multiclass problems the F-statistic is computed as an overall test from the t-statistics for every genetic probe. We use the eBayes-implementation in the R-package limma (v2.12). References: - Loennstedt, I. and Speed, T. P. (2002). Replicated microarray data. Statistica Sinica 12, 31-46. - Smyth, G. K. (2004). Linear models and empirical Bayes methods for assessing differential expression in microarray experiments. Statistical Applications in Genetics and Molecular Biology, 3, No. 1, Article 3 |
RF-MDA - Random Forest Feature Selection | [X] |
Short description: A random forest (RF) classifier with 200 trees is applied and the importance of features is estimated by means of the mean decrease in accuracy (MDA) for the out-of-bag samples. We use the RF implementation from the "randomForest" R-package based on L. Breiman's random forest algorithm. References: - Breiman, L. (2001), Random Forests, Machine Learning 45(1), p. 5-32 |
ENSEMBLE - Ensemble Feature Selection | [X] |
Short description: This selection method combines the eBayes, SAM, PLS-CV and and RF-MDA selection schemes to an ensemble feature ranking. The CFS method is not included, because it is designed to remove redundant features, which can be useful for machine learning purposes but might also be undesirable for the direct interpretation of gene selection results (interesting genes might be filtered out, if they have high correlation to other selected genes). All methods receive the same weight and the final ranking is obtained from the sum of the individual ranks. |
Singh et al. (2002) Prostate cancer data set | [X] |
Short description: Analysis of prostate cancer tissues (1) and normal tissues (0). Sample types: tumour, healthy No. of genes: 2135 (pre-processed) No. of samples: 102 (class 1: 52, class 0: 50) Normalization: GeneChip RMA (GCRMA) References: - D. Singh, P.G. Febbo, K. Ross, D.G. Jackson, J.Manola, C. Ladd, P. Tamayo, A.A. Renshaw, A.V. D’Amico, J.P. Richie, et al. Gene expression correlates of clinical prostate cancer behavior. Cancer Cell, 1(2): pp. 203–209, 2002 - Z. Wu and R.A. Irizarry. Stochastic Models Inspired by Hybridization Theory for Short Oligonucleotide Arrays. Journal of Computational Biology, 12(6): pp. 882–893, 2005 |
Shipp et al. (2002) B-Cell Lymphoma data set | [X] |
Short description: Analysis of Diffuse Large B-Cell lymphoma samples (1) and follicular B-Cell lymphoma samples (0). Sample types: DLBCL, follicular No. of genes: 2647 (pre-processed) No. of samples: 77 (class 1: 58, class 0: 19) Normalization: VSN (Huber et al., 2002) References: - M.A. Shipp, K.N. Ross, P. Tamayo, A.P. Weng, J.L. Kutok, R.C.T. Aguiar, M. Gaasenbeek, M. Angelo, M. Reich, G.S. Pinkus, et al. Diffuse large B-cell lymphoma outcome prediction by gene-expression profiling and supervised machine learning. Nature Medicine, 8(1): pp. 68–74, 2002 - Huber et al., Variance stabilization applied to microarray data calibration and to the quantification of differential expression, Bioinformatics (2002) 18 Suppl.1 96-104 |
Shin et al. (2007) T-Cell Lymphoma data set | [X] |
Short description: Analysis of cutaneous T-Cell lymphoma (CTCL) samples from lesional skin biopsies. Samples are divided in lower-stage (stages IA and IB, 0) and higher-stage (stages IIB and III) CTCL. Sample types: lower_stage, higher_stage No. of genes: 2922 (pre-processed) No. of samples: 63 (class 1: 20, class 0: 43) Normalization: VSN (Huber et al., 2002) References: - J. Shin, S. Monti, D. J. Aires, M. Duvic, T. Golub, D. A. Jones and T. S. Kuppe, Lesional gene expression profiling in cutaneous T-cell lymphoma reveals natural clusters associated with disease outcome. Blood, 110(8): pp. 3015, 2007 - Huber et al., Variance stabilization applied to microarray data calibration and to the quantification of differential expression, Bioinformatics (2002) 18 Suppl.1 96-104 |
Armstrong et al. (2002) Leukemia data set | [X] |
Short description: Comparison of three classes of Leukemia samples: Acute lymphoblastic leukemia (ALL, 0), acute myelogenous leukemia (AML, 1) and ALL with mixed-lineage leukemia gene translocation (MLL, 3). Sample types: ALL, AML, MLL No. of genes: 8560 (pre-processed) No. of samples: 72 (class 0: 24, class 1: 28, class 2: 20) Normalization: VSN (Huber et al., 2002) References: - S.A. Armstrong, J.E Staunton, L.B. Silverman, R. Pieters, M.L. den Boer, M.D. Minden, S.E. Sallan, E.S. Lander, T.R. Golub, S.J. Korsmeyer; MLL translocations specify a distinct gene expression profile that distinguishes a unique leukemia. Nature Genetics, 30(1): pp. 41–47, 2002 - Huber et al., Variance stabilization applied to microarray data calibration and to the quantification of differential expression, Bioinformatics (2002) 18 Suppl.1 96-104 |
Help | [X] |
Close |
Microarray Gene Selection Analysis
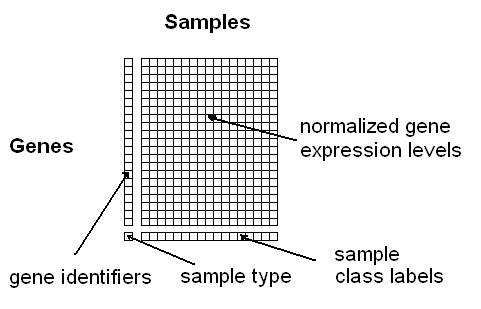
This module allows you to select differentially expressed genes for microarray data with labelled samples.
To obtain instructions click on help.